Amazon Connect Analytics
 Salesforce Service Cloud Analytics
 Customer Journey Analytics
 Back
Back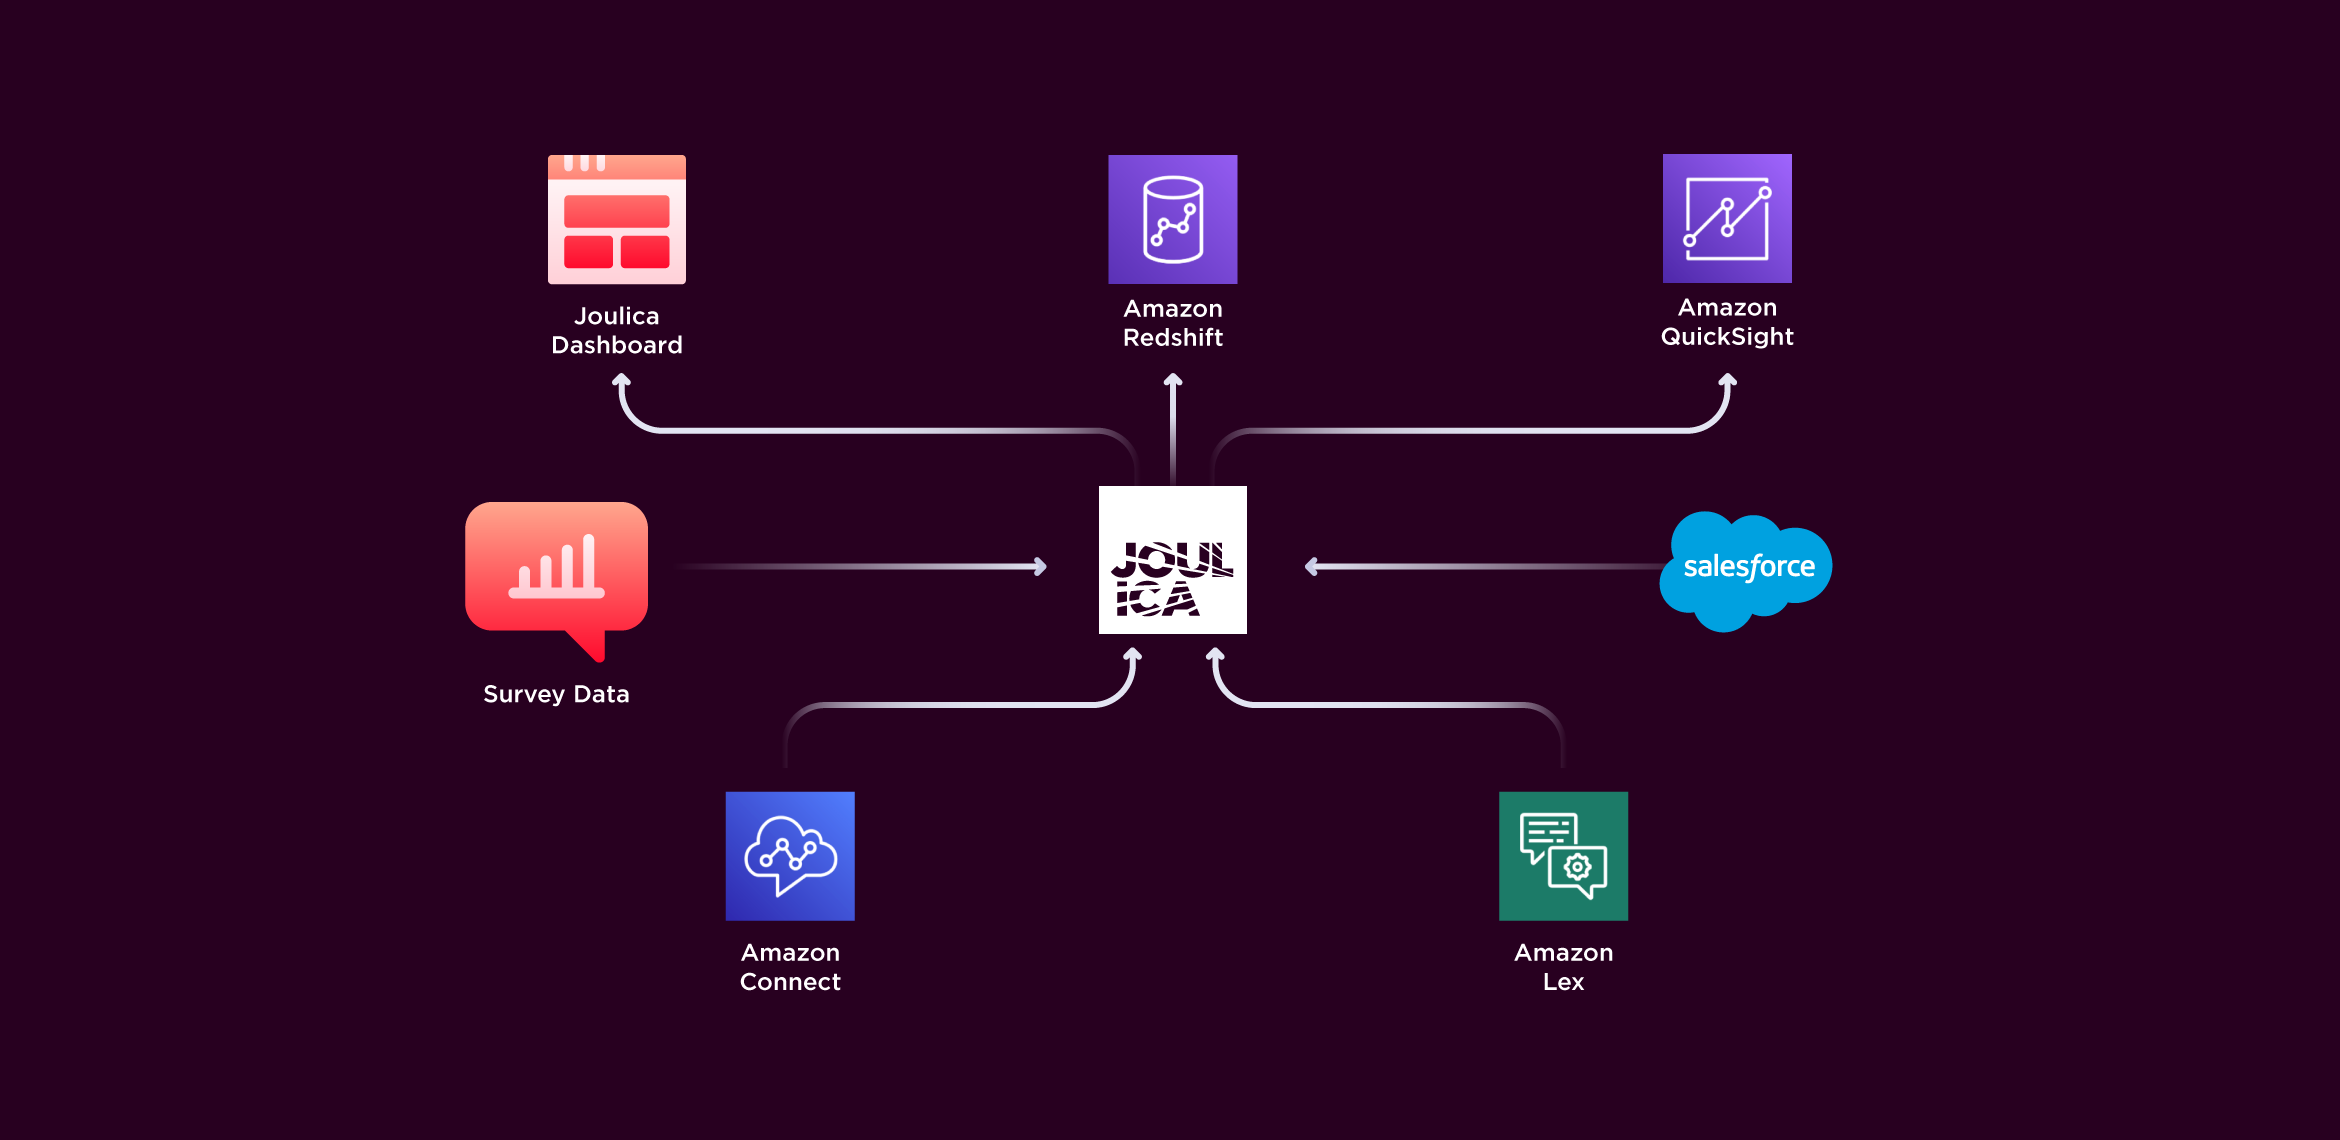
In our previous article, we introduced some of the core capabilities that the Joulica platform provides when deployed with Amazon Connect, namely
- Rich, graphical real-time dashboards
- Data authorisation for customer service centers that utilise outsourced agents
- Amazon Quicksight historical reports and analytics
Here, we introduce another key value that Joulica provides: Amazon Lex analytics.
Introduction to Lex Analytics
Amazon Lex and Amazon Connect allow organisations to build rich conversational interfaces that deliver exceptional customer experiences and optimise customer service operations. Joulica builds on these capabilities by providing real-time and historical analytics for the Lex bots powering these conversations, the contact flows which invoke them, the intents being fulfilled and those scenarios which require improvement.
Common use cases we solve for include: -
- Increasing self-service containment rates
- Analysing the customer experience delivered by Lex bots
- Decreasing abandon rates and missed intents
In this article, we describe the capabilities of the Joulica platform when deployed with Amazon Connect and Amazon Lex, with respect to these use cases.
We will cover our Customer Journey analytics capabilities as well our integration with Salesforce Service Cloud in the next couple of posts.
Customer Self-Service and Containment
Containment is a measure of the ability to automate customer interactions and applies to all channels, including chat and voice. In cases where a Lex bot has been designed to automate a high percentage of customer interactions, e.g., a password reset service, it is critical that analytics are available to maintain a high level of automation. For example,
- Which intents are resulting in high levels of agent transfers?
- Which slots are customers having the most difficulty with?
- Is one channel performing poorly compared to others?
- Are certain customer segments experiencing poor levels of automation?
- Are specific lines of business or product categories exhibiting poor levels of containment?

The above dashboard shows an example of the out-of-the-box analytics that Joulica provides in this area. The Lex intents that are resulting in high queue transfers, or those that are resulting in high abandon rates as well as data related to the highest number of missed intents are available in real-time and for historical analysis.
If you want to drill into individual slots and find the slots which are causing customers the most issues, you can use the following type of analysis.

Here, customers are failing to complete intents most frequently at the point where they need to specify their Account Type (the top right-hand bar in the dashboard). The dashboard is fully interactive and so users can determine if this is specific to chat or voice, or even a different variable such as the type of messaging app the customer is using. Since these analytics are available in both real-time and historically, it is straightforward to surface issues as they appear and correlate with past performance.
Customer Satisfaction and NPS
Because Joulica analyses the entire customer journey and can enrich data with additional information sources, analytics are also available to give insights into how customers are experiencing the automated conversations provided by Lex. Since Amazon Connect allows customer surveys to be easily integrated into the solution, Joulica can utilise the feedback provided by the customer and correlate it with the rest of the session.

Organisations can measure customer satisfaction and NPS at the aggregation level(s) that are relevant to their operation – e.g., at the Bot level, channel, intent, contact flow, or agent/queue for those sessions transferred for agent assistance. In the above dashboard, the top-left widget shows NPS scores for each intent, whilst the top right shows similar information for each agent (further broken down by queue). The bottom widget shows NPS information at a number of dimensions including contact flow, channel, Intent, and Queue, and so is useful for exploring data. If additional data is available, e.g., customer product or segment, then this data can be easily incorporated and added as additional dimensions, allowing Joulica users to drill into the analytics.
Once organisations can analyse both containment efficiency and customer feedback in a seamless manner, they can start to optimise service strategies to optimise both automation levels and customer experience.
Historical Lex Analytics
In the previous article, we drew attention to our integration with Amazon Redshift and the powerful analytical capabilities this enables with Amazon Quicksight. In the area of Amazon Lex analytics, this translates to a powerful set of historical analytics for all customer conversations on all channels that have been served by Lex. A simple example is shown below where Joulica has aggregated data for a particular Lex bot, broken down by those conversations which were fully automated (blue) and those which required an agent (orange). Users can use standard QuickSight capabilities to drill into the data further. All of the analytical data detailed in this article is published automatically to Redshift and so is available to Quicksight users.

Coming Next
This article detailed just some of the Lex analytics capabilities that Joulica provides. Next up, we will explain how Joulica complements Salesforce Service Cloud and our rich Customer Journey analytics that can mesh together a wide variety of data sources into actionable insights that improve the customer experience. Watch this space!