Amazon Connect Analytics
 Salesforce Service Cloud Analytics
 Customer Journey Analytics
 Back
Back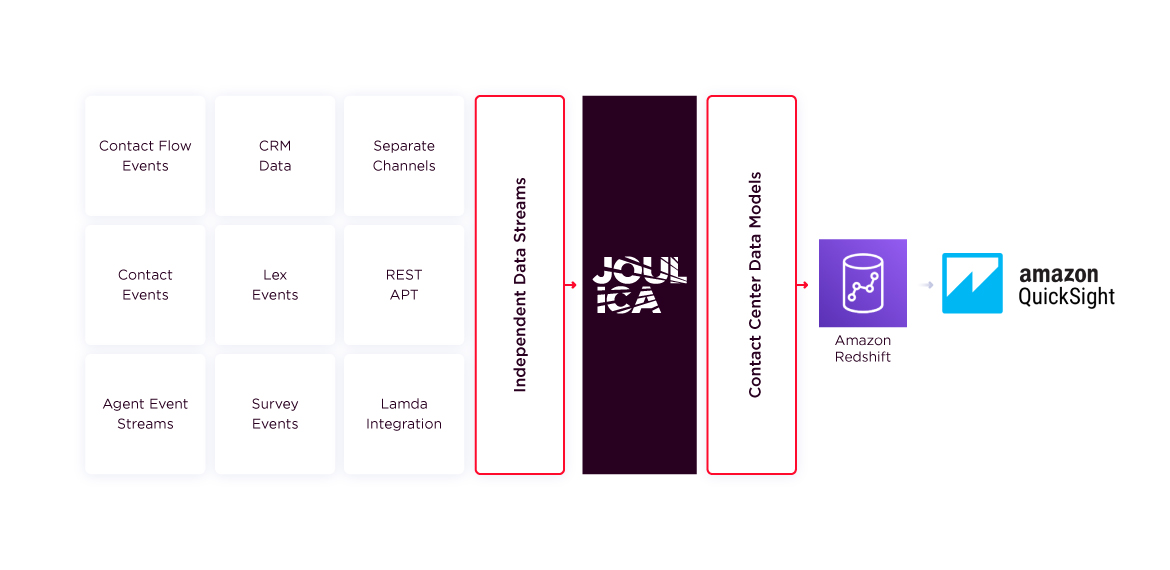
As detailed in previous articles, the Joulica platform transforms the rich data feeds from Amazon Connect into enterprise-ready real-time and historical reporting metrics. Realtime metrics are made available to contact center supervisors and managers through a web-based application that allows users to easily create, modify and share rich data visualisations. Custom metrics and familiar data models from on-premise contact center technology vendors accelerate migrations to Amazon Connect.
Metrics are also persisted automatically by the Joulica platform to Amazon Redshift, allowing Amazon Quicksight to be used for graphical and tabular historical reports and dashboards (other BI tools may also be used where they are already used in an organisation). This also caters to general customer experience and customer services business intelligence use cases where contact center data needs to be joined with other Enterprise data sources.
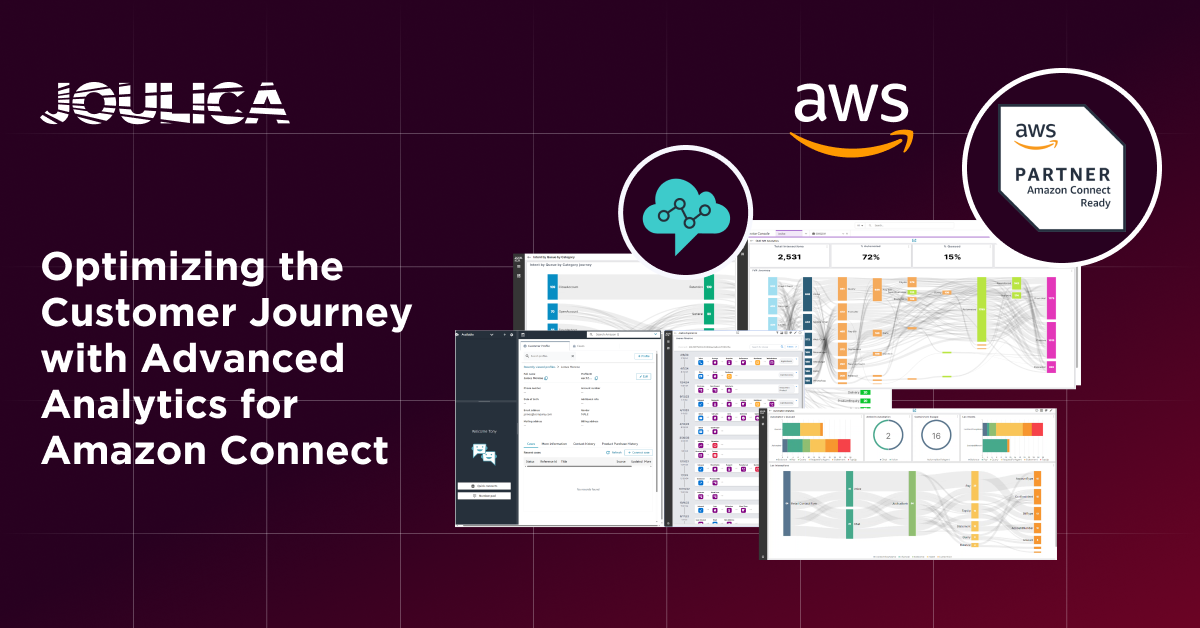
This article focuses on the capabilities provided by Joulica in this area: historical contact center reporting and analytics for Amazon Connect.
Introduction
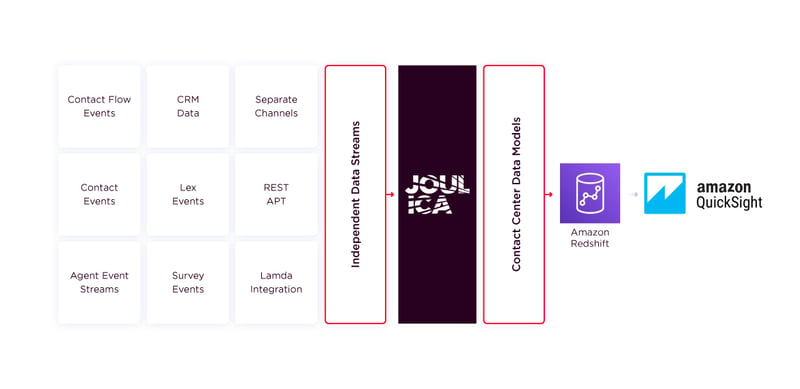
Joulica utilises a streaming analytics architecture to ingest, correlate and transform the rich set of event feeds and data sources provided by Amazon Connect. To achieve this task, Joulica utilises the latest AWS services for scalable real-time computation, including Elastic Kubernetes, Managed Kafka and ElastiCache.
Examples of the event feeds supported by Joulica are:
- Agent Event Stream
- Contact events
- Contact trace records
- Cloud watch logs
- Amazon Lex events
- Contact Flow events
- Salesforce events
Other, deployment-specific, data sources can be easily configured and consumed via Kafka and REST.
The platform automatically translates this data into both standard metrics and user-defined, customisable, contact center metrics. The resulting metrics are pushed to Amazon Redshift as clean, interval-based data models, aggregated at multiple levels, including agent, queue, and customised dimensions.

The above figure shows just some of the contact center data models automatically provided by the platform. Simple examples are Agent and Queue metrics, with another example being Contact Flow metrics – which are useful when optimising the behaviour of a Contact Flow application. A more complex example of a data model automatically provided by Joulica are metrics dimensioned by ContactFlow, Channel, Lex Bot, Intent, and Slot, allowing deep analysis of Lex performance at the slot level for every contact flow, channel, and intent.
The platform ships with metrics defined at over 40 dimensions (Agent, Queue, Agent by Queue etc), with users able to configure additional dimensions and metrics easily.
Quicksight for Self-Service Reporting
With the Joulica platform taking care of the heavy lifting of transforming the Amazon Connect data feeds into clean metric models, using Amazon Quicksight to create rich, interactive dashboards and reports couldn’t be easier. Amazon Quicksight has been designed as an intuitive self-service application that allows business users to create, edit and share analytical dashboards. The example dashboard below shows:
- Agent Performance metrics
- Agent Activity metrics
- Agent by Queue metrics
- Agent NPS metrics

This is just an example of a dashboard that can be created in a few minutes. During a deployment, Joulica creates a number of standard reports, including
Agent Performance Report - Report displays key agent performance metrics for selected agents.
Agent Hierarchy Report - Report displays key agent performance metrics for selected agent hierarchies.
Agent State Report - Report displays time in state metrics for selected agents.
Agent Queue Performance Report - Report displays key agent performance metrics for selected agents broken down by queue.
Agent Channel Performance Report - Report displays key agent performance metrics for selected agents broken down by channel.
Agent Channel Queue Performance Report - Report displays key agent performance metrics for selected agents broken down by channel and queue.
Queue Performance Report - Report displays key queue performance metrics for selected queues.
Queue Channel Performance Report - Report displays key queue performance metrics for selected queues, broken down by channel.
Queue CSAT Report - Report displays customer satisfaction metrics derived from survey data for selected queues.
Contact Flow Performance Report - Report displays key metrics for selected Contact Flows. Contact Flows are associated with inbound dialed numbers.
Contact Flow Queue Performance Report - Report displays key metrics for selected Contact Flows, broken down by queue. Contact Flows are associated with inbound dialed numbers.
Contact Flow Channel Queue Performance Report - Report displays key metrics for selected Contact Flows, broken down by channel and queue. Contact Flows are associated with inbound dialed numbers.
Contact Flow Automation Report - Report displays automation-related metrics for selected Contact Flows.
Contact Flow CSAT Report - Report displays customer satisfaction metrics derived from survey data for selected Contact Flows.
Automation Bot Performance Report - Report displays key metrics for selected Lex Bots
Automation Intent Performance Report - Report displays key metrics for selected Lex Intents
Customer Journey NPS Report - Report displays net promoter score metrics derived from customer survey data for selected customer journeys
A sample Lex report is shown below. The top bar chart shows the daily containment rate vs those calls transferred to agents over a 30-day period. The bottom visualisation shows a more detailed breakdown, where for each Lex intent, the number automated and abandoned are shown, along with other metrics such as the number of conversations where the intent was missed. As you would expect, Amazon Quicksight allows the user to layout the data visualisations according to their specific needs, change the visualisation types and adjust both individual colors as well as the overall dashboard theme (e.g. to change to a dark theme).

A major part of any contact center migration project is dealing with the differences between the target-state contact center platform and the legacy solution. Over the years, users and application integrations become dependent on specific reports (including aggregation dimensions) and metric definitions. Examples are toll-free number reports and specific service-level definitions. A more nuanced example is how calls that traverse interval boundaries are reported on (attribution). A unique aspect of the Joulica platform is its ability to allow users to configure custom metrics and cater to the variety of attribution models that exist in the industry. This means that the historical reports and data produced by the Joulica platform can significantly alleviate the burden of the differences between the two reporting systems, and the transition to Amazon Connect to be accelerated in a seamless fashion.
Coming Next
Watch out for our next series of articles that will detail how Joulica complements Salesforce Service Cloud, an exploration of our rich Customer Journey analytics, and lots of video demonstrations.