Amazon Connect Analytics
 Salesforce Service Cloud Analytics
 Customer Journey Analytics
 Back
Back
This post expands on previous articles where we detailed how Joulica extends the powerful capabilities of Amazon QuickSight with real time, streaming analytics. You can get a good overview here: Unified Realtime and Historical Analytics with Amazon QuickSight. In this article, we will focus on the following use cases and industry verticals:-
- Customer Experience
- Internet of Things
- Sales
- Healthcare
A common architectural pattern is followed for all of these: -
- Amazon Kinesis for streaming data
- Joulica platform for realtime analytics
- Amazon QuickSight for dashboard creation
- Amazon QuickSight Custom Visual Content (see Using custom visual content)
The following diagram shows the approach. As can be seen, Amazon Kinesis is used here as the primary means of accessing streaming data. Utilising Kinesis has many advantages, including the broad integrations that are in place across the AWS ecosystem and cloud applications generally.
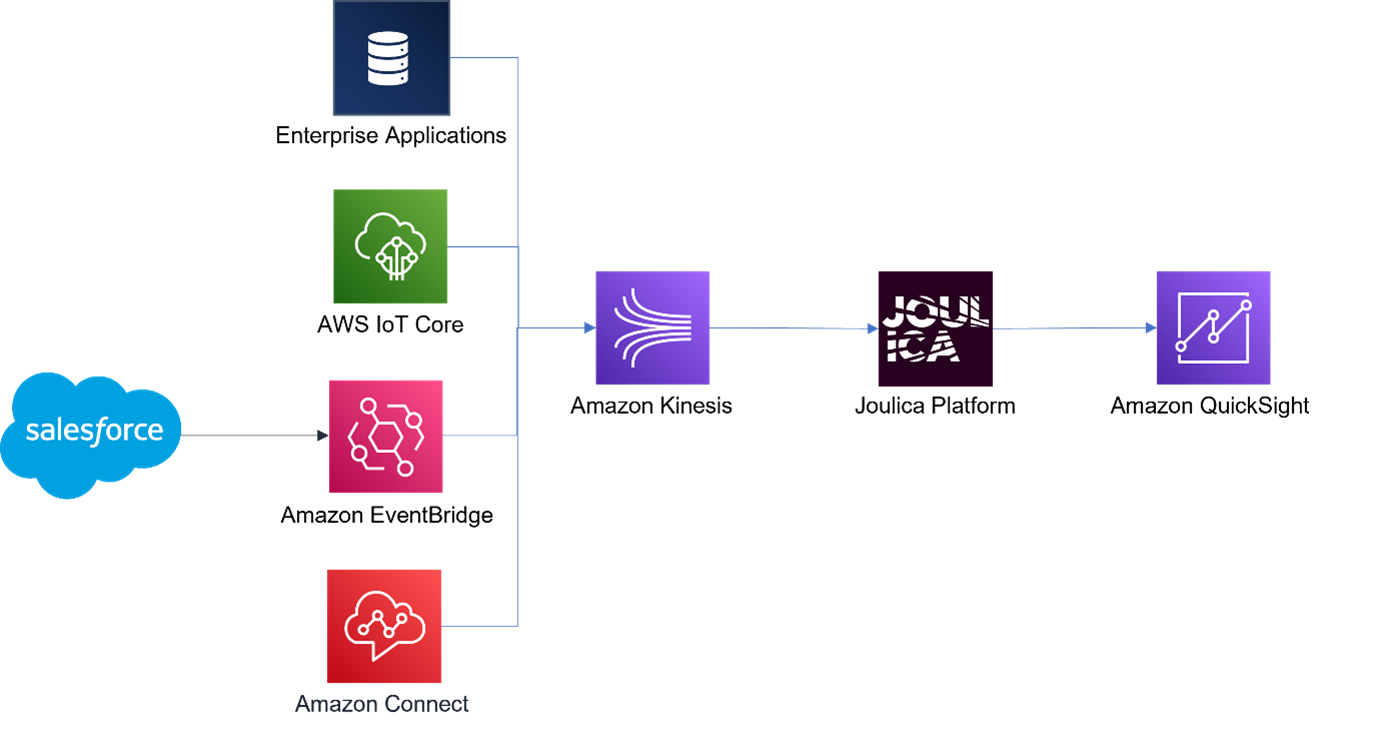
The Joulica platform allows users to transform and analyse data from Kinesis, and for the resulting analytics to be incorporated into visual widgets. Each widget is a separate web component, and we utilise the Custom Visual Content type to embed the Joulica components within QuickSight dashboards. We make heavy use of the Free-form layout to produce the infographic-style visualisations below.
The following sections detail examples from each of the use cases and verticals.
Customer Experience
The first example is from the Customer Experience market and utilises Amazon Connect as the core CCaaS solution. Realtime Contact Center KPIs are shown along with sales and customer sentiment analytics. Historical data is also shown, highlighting the seamless integration between the real-time and historical KPIs.
Internet of Things
The next example shows streaming sensor data across a number of devices, alongside a daily trend (with the historical trend visualisation a core capability of QuickSight). For reference, the solution architecture is similar to that depicted in Detect water leaks in near real time using AWS IoT where device data is streamed by AWS IoT services onto Amazon Kinesis. As new data becomes available, updates are pushed automatically to the Joulica web components within QuickSight. The result is shown below (for reference, the Joulica components are on the right).
Sales
It is critical that leaders have access to up-to-date sales data across all channels and regions. In the example here, Salesforce is providing sales data via the Salesforce Event Relay. Data arrives at AWS Event Bridge, which is configured to push the information to Kinesis. From there, Joulica can ingest the data and enable the QuickSight dashboard shown below. This example illustrates the QuickSight free-form layout features nicely, with all of the data overlaid on a map.
Healthcare
The final example is taken from the Healthcare field and focuses on a number of critical KPIs such as admission wait times, bed occupancy, and length of stay. These KPIs are mainly relevant to Admissions optimisation, but there are many more, including equipment utilisation and staffing. It is becoming increasingly important for these metrics to be monitored in real-time and made available to all stakeholders, including the broader community, in some cases.
Summary
This post provided a number of examples where the combination of Joulica, Kinesis, and QuickSight can be used to provide unified real time and historical analytics across a number of domains and use cases. Other data streaming technologies, e.g., Kafka, are also supported, and naturally, there are many more verticals and areas that benefit from having access to live analytics.
If you are interested in finding out more, contact us at info@joulica.io or visit www.joulica.io/request-demo to arrange a demo.