Amazon Connect Analytics
 Salesforce Service Cloud Analytics
 Customer Journey Analytics
 Back
Back
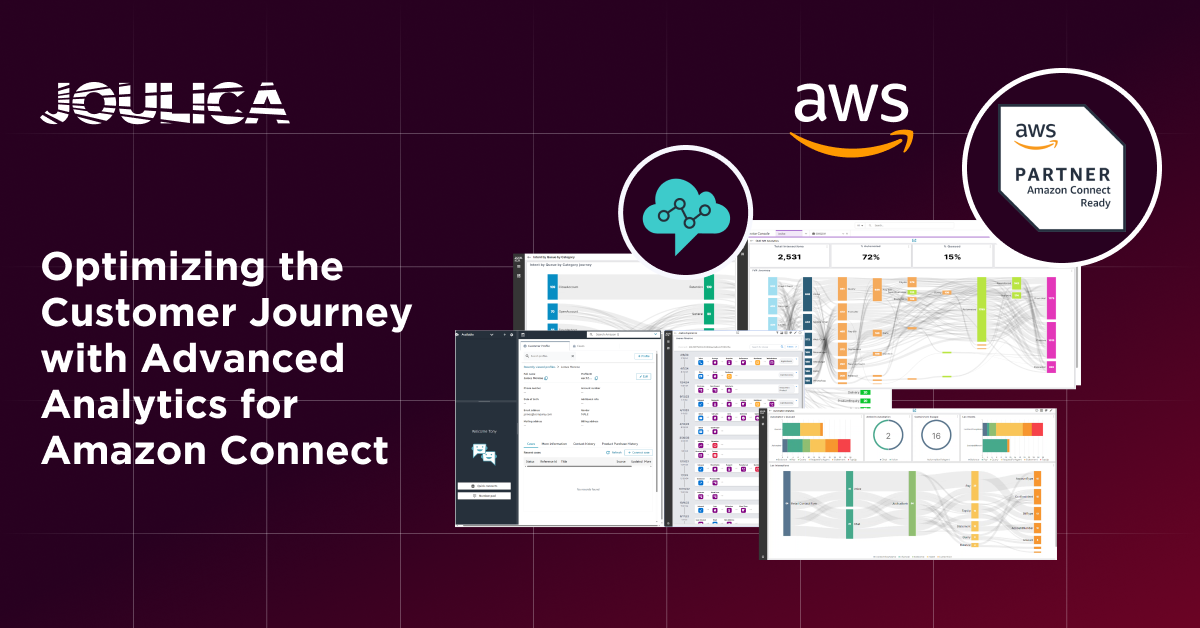
Amazon Connect makes it easy to measure the sentiment of all customer interactions (see Analyze conversations using Contact Lens for Amazon Connect) as well as allowing post contact surveys to be incorporated into both automated conversations as well those that require an agent (e.g. see Flexible contact surveys with Amazon Connect). AWS makes this data available via a number of integration options – covering both real-time and historical analytics use cases. This post covers some examples of how Joulica transforms this data to provide customer experience insights. We cover the following:
- Are certain channels working better than others?
- Are individual customer segments experiencing difficulties?
- Are customers more satisfied with certain product lines?
- How does customer satisfaction and sentiment vary across teams and agents?
- Are there regional differences?
We will begin with Net Promoter Score and Sentiment analysis across customer facing channels, as well as analysing some trends over time. The analysis below is an example.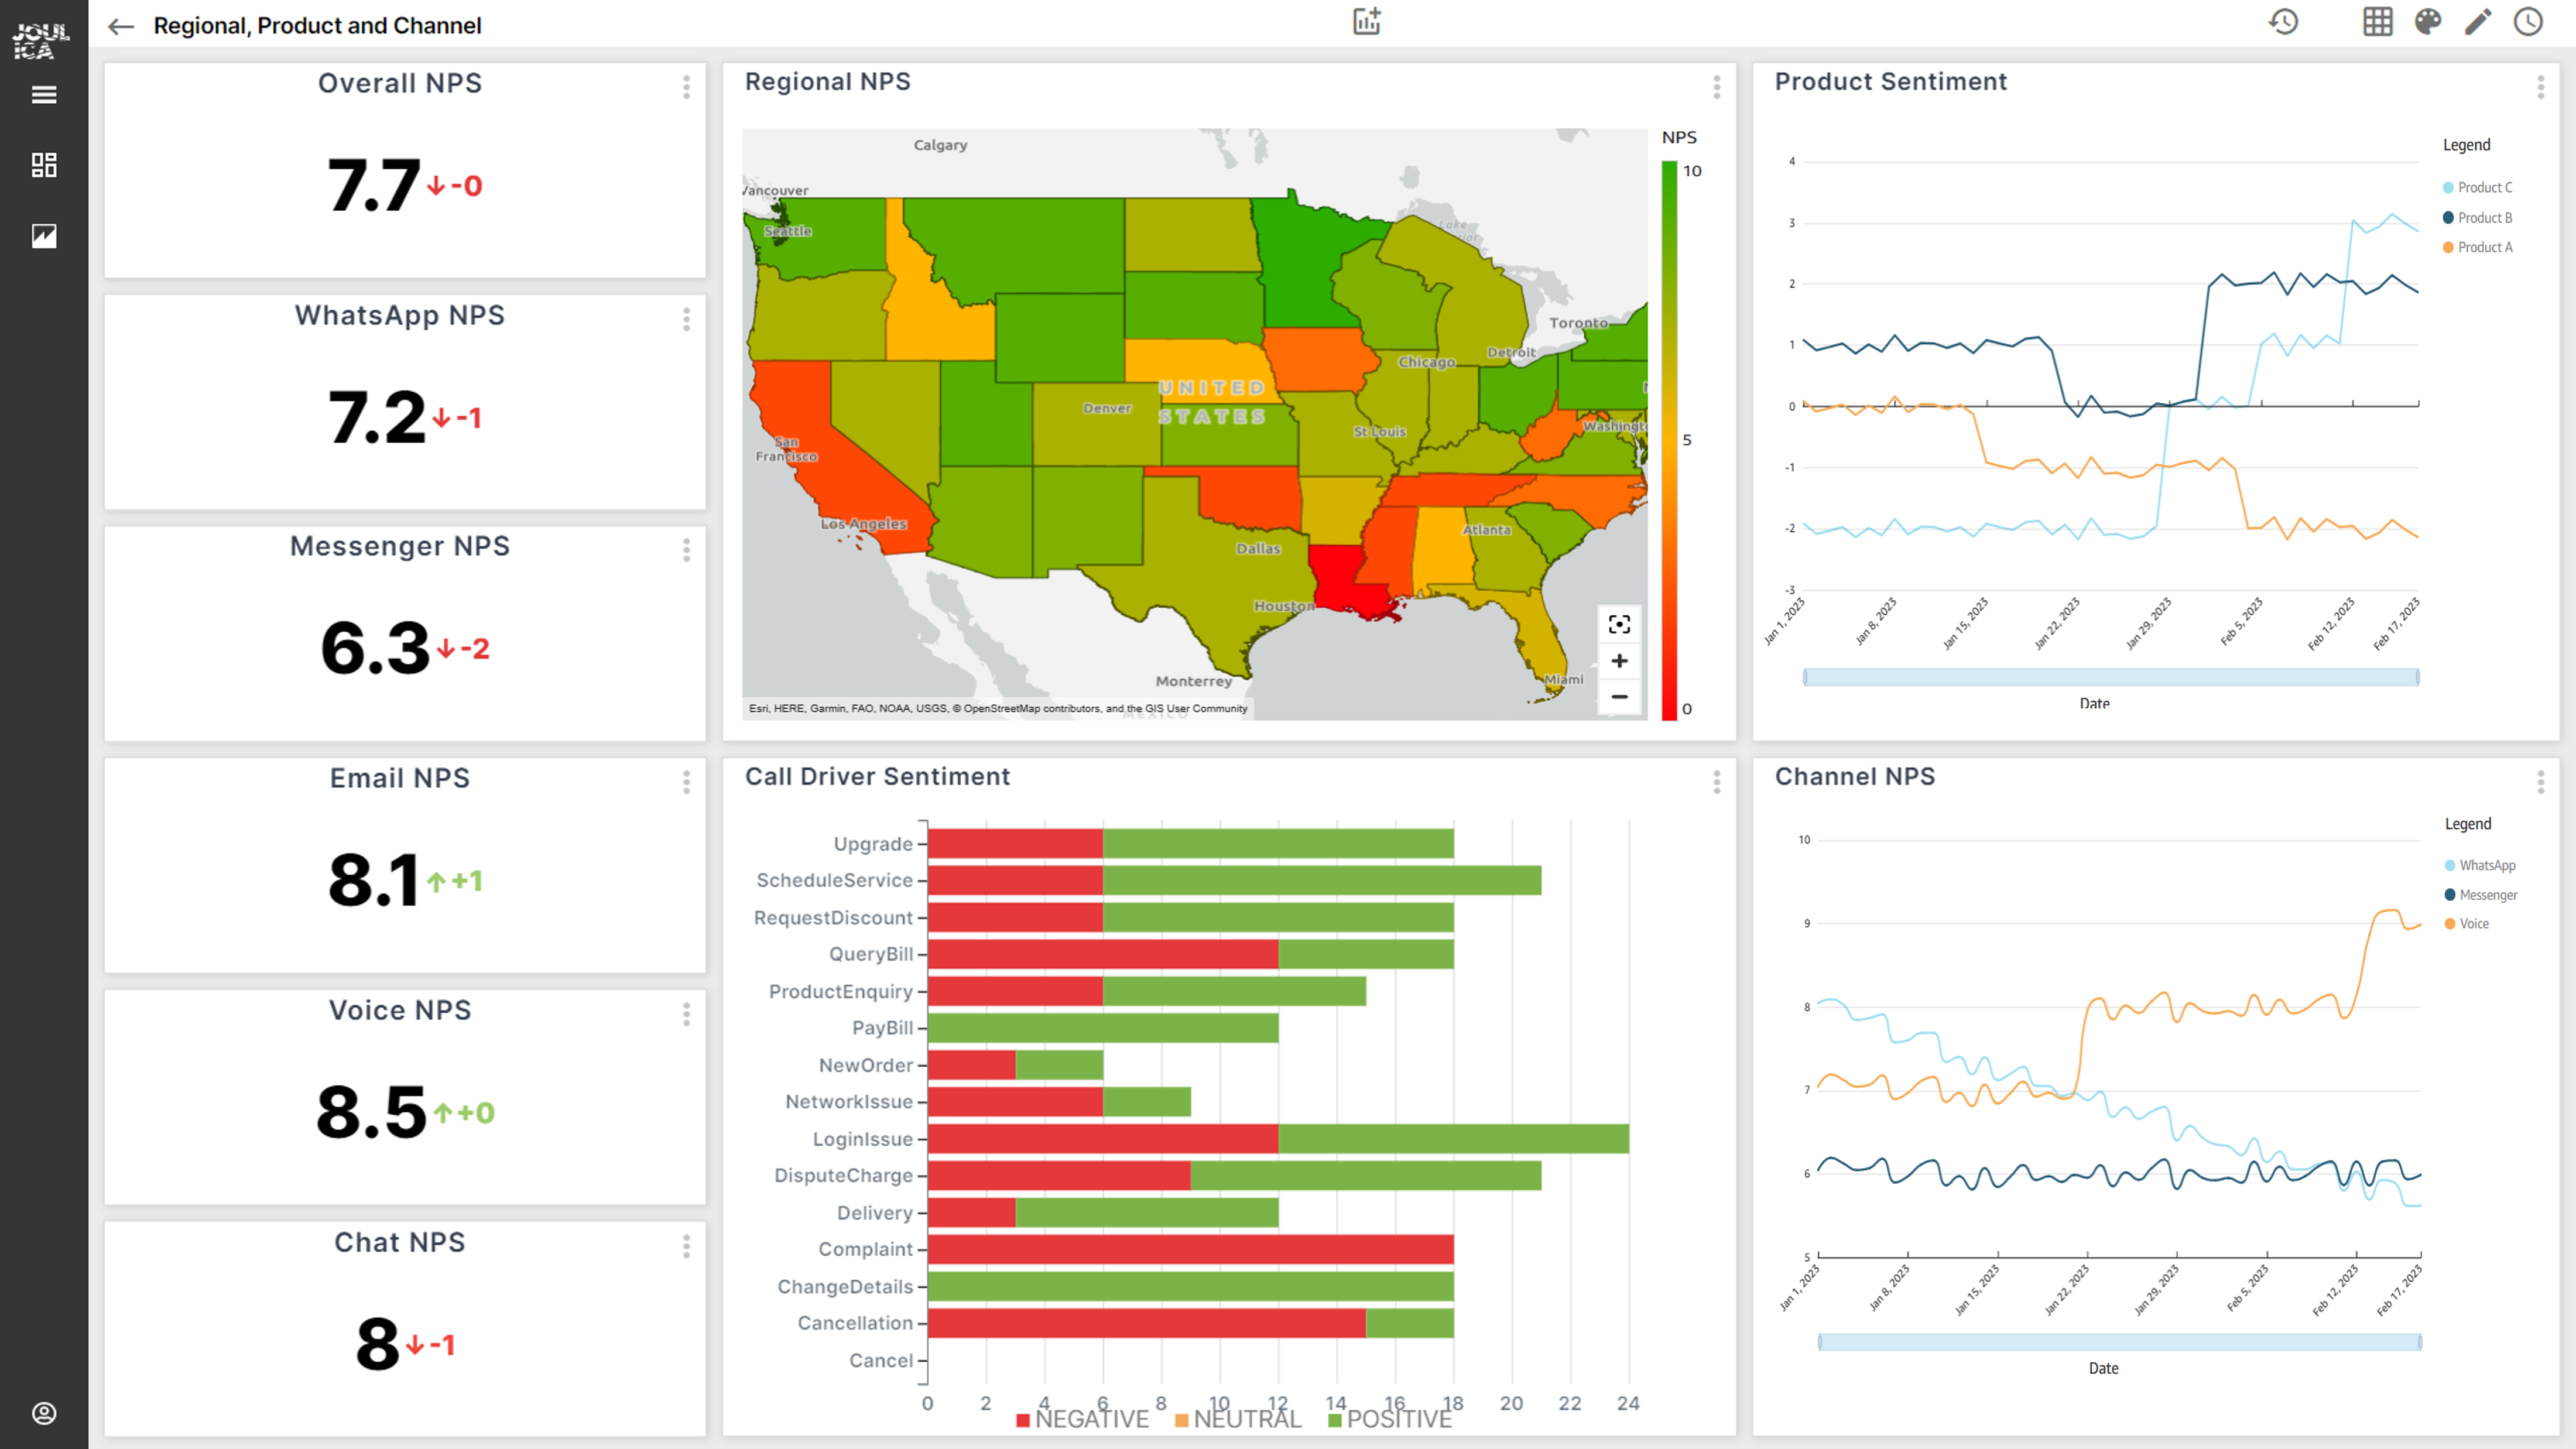
This shows NPS for each channel, along with a regional breakdown by US state - there are some states where customer feedback is indicating that there are issues that need attention. In addition, we have broken down the sentiment of each call driver (based on Contact Lens interaction analytics). To the right, this sentiment data is broken down further by Product (here we use a Contact Attribute to get this data), showing that Sentiment associated with Product A is deteriorating over time. NPS for WhatsApp based interactions similarly suggests a customer experience issue on this channel.
The above example uses one of our most recently introduced capabilities, which is based on Fine Grained Visual Embedding from Quicksight (see Fine-Grained Visual Embedding Powered by Amazon QuickSight). With this, we can fully integrate rich Quicksight visualisations natively within Joulica dashboards – allowing a fully unified view of real-time and historical analytics.
Understanding how individual teams are performing is equally important. In the example below, we show real-time Team KPIs as well as a breakdown of the KPIs for each agent. 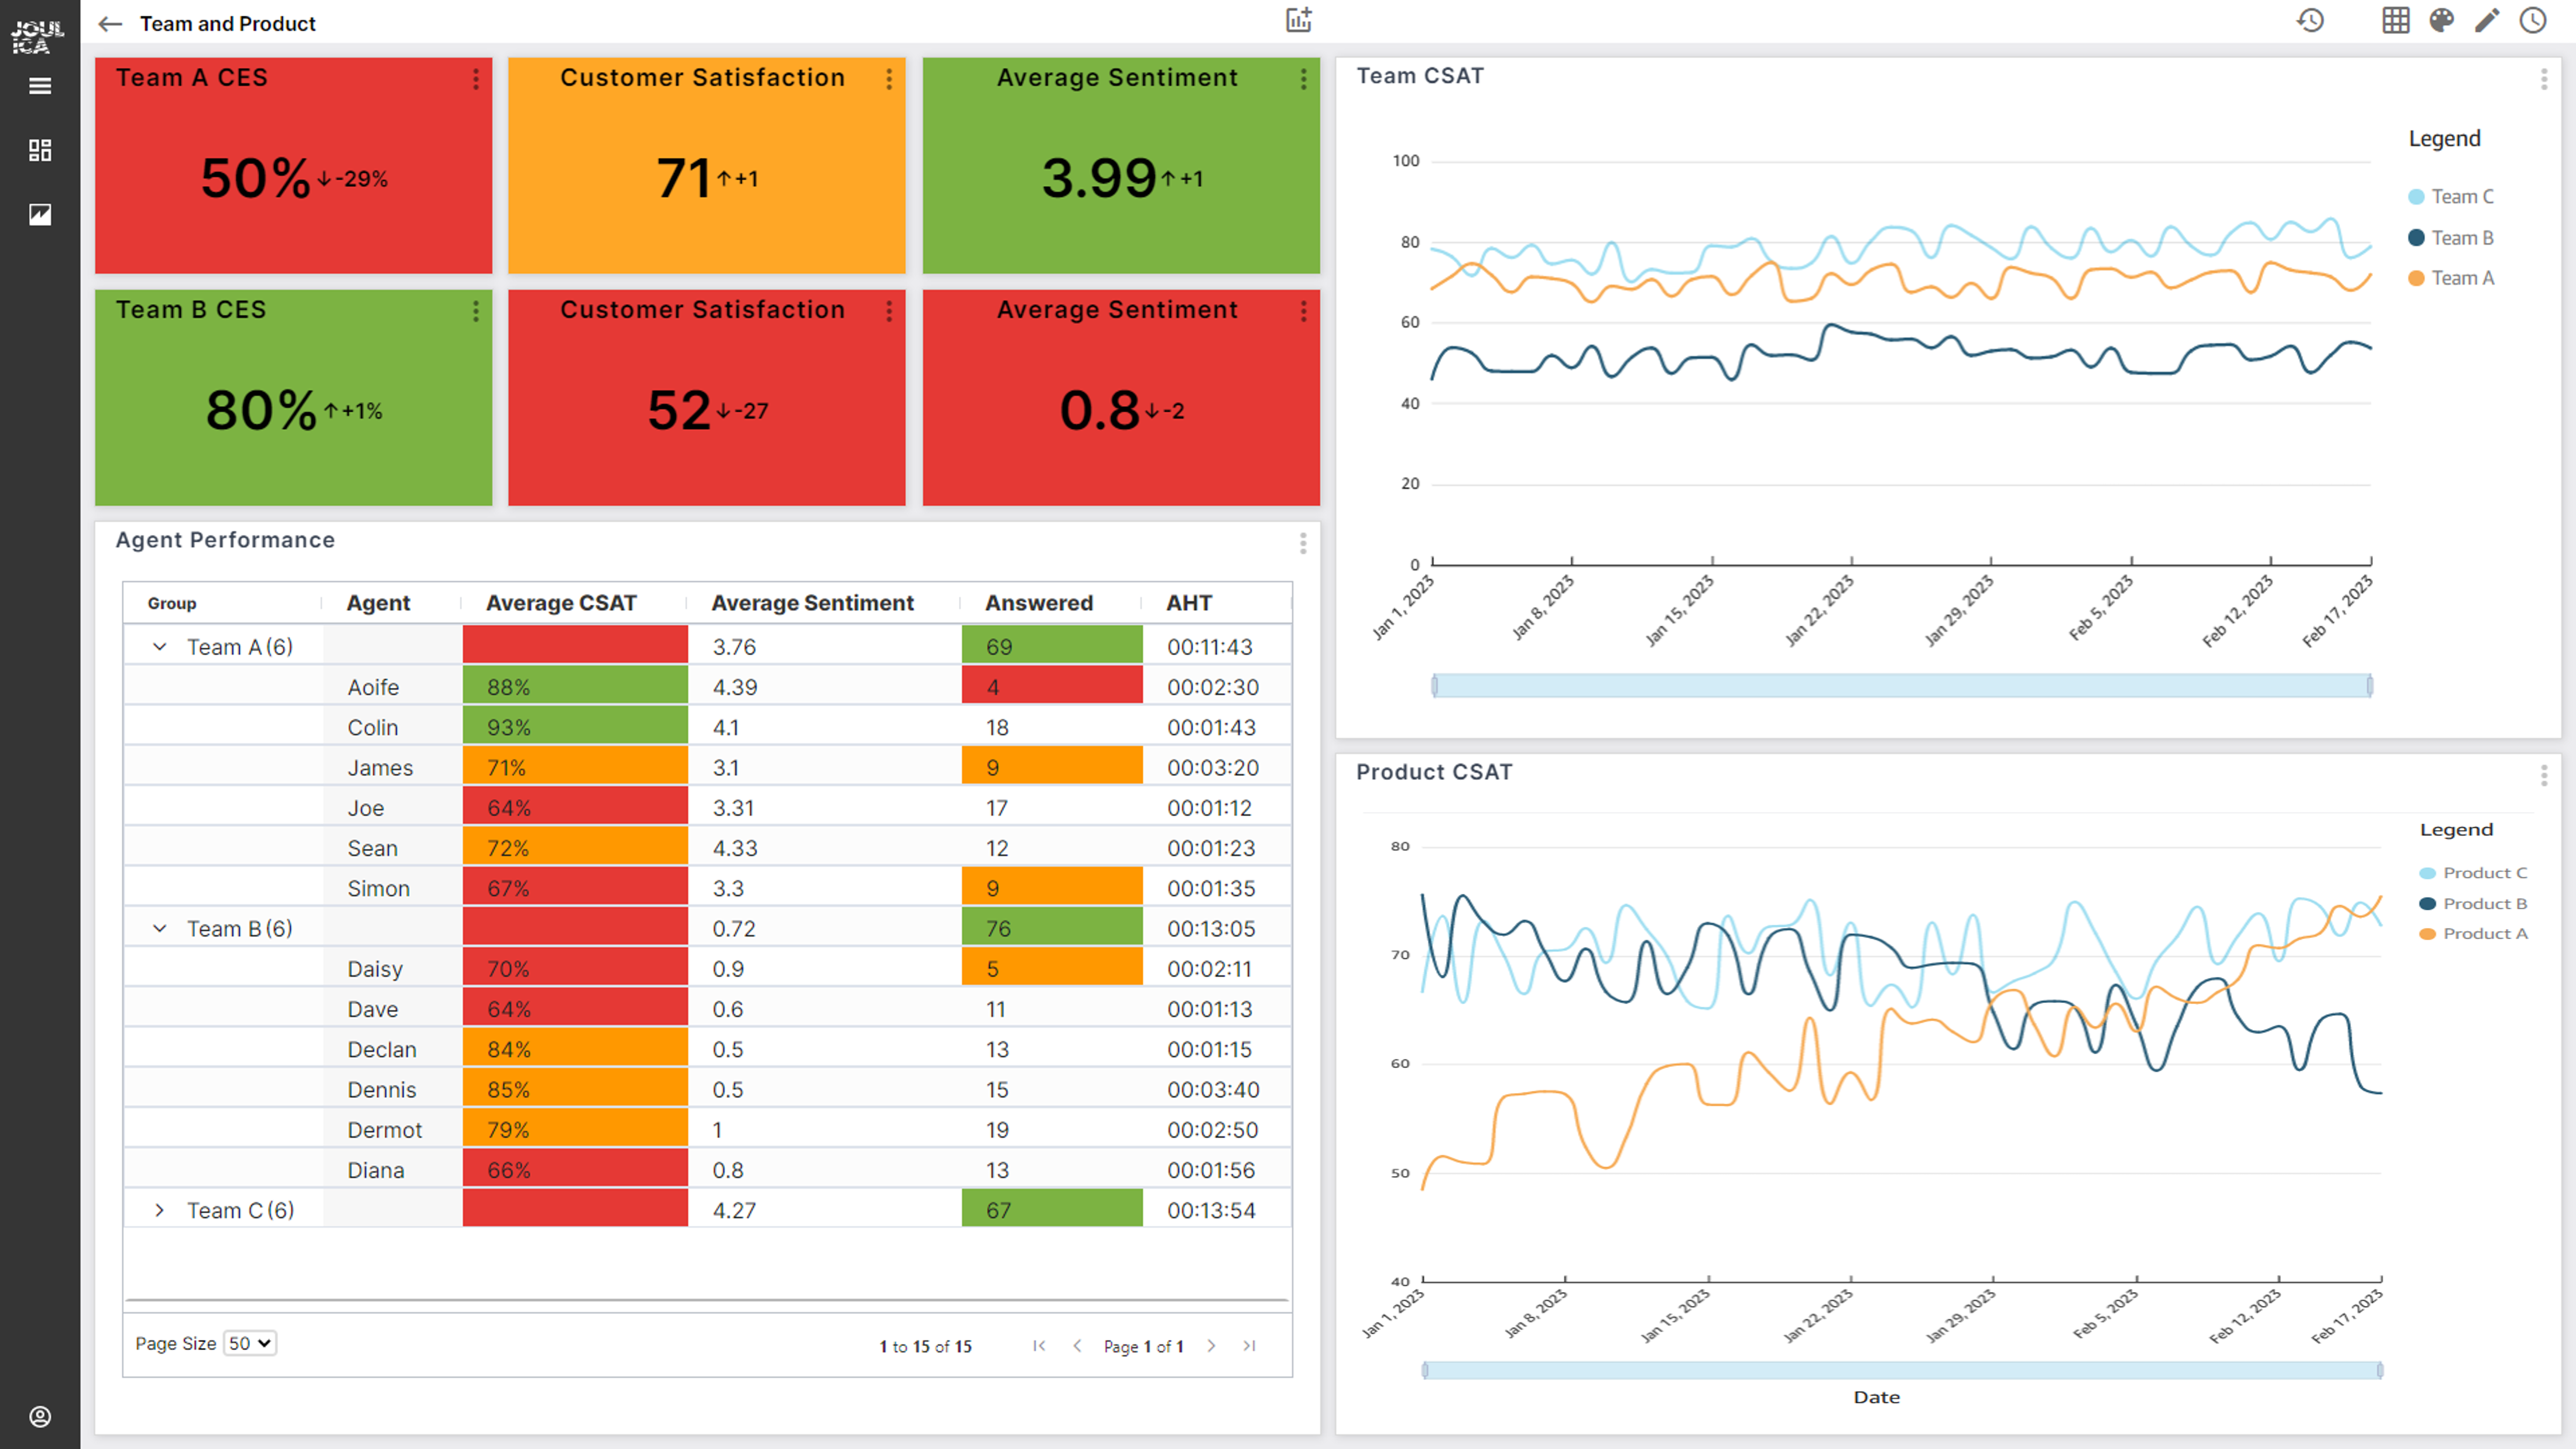
Using this, issues can be addressed immediately – with trends showing performance over time. KPIs such as CSAT can also easily be broken down by Product, as in the previous example.
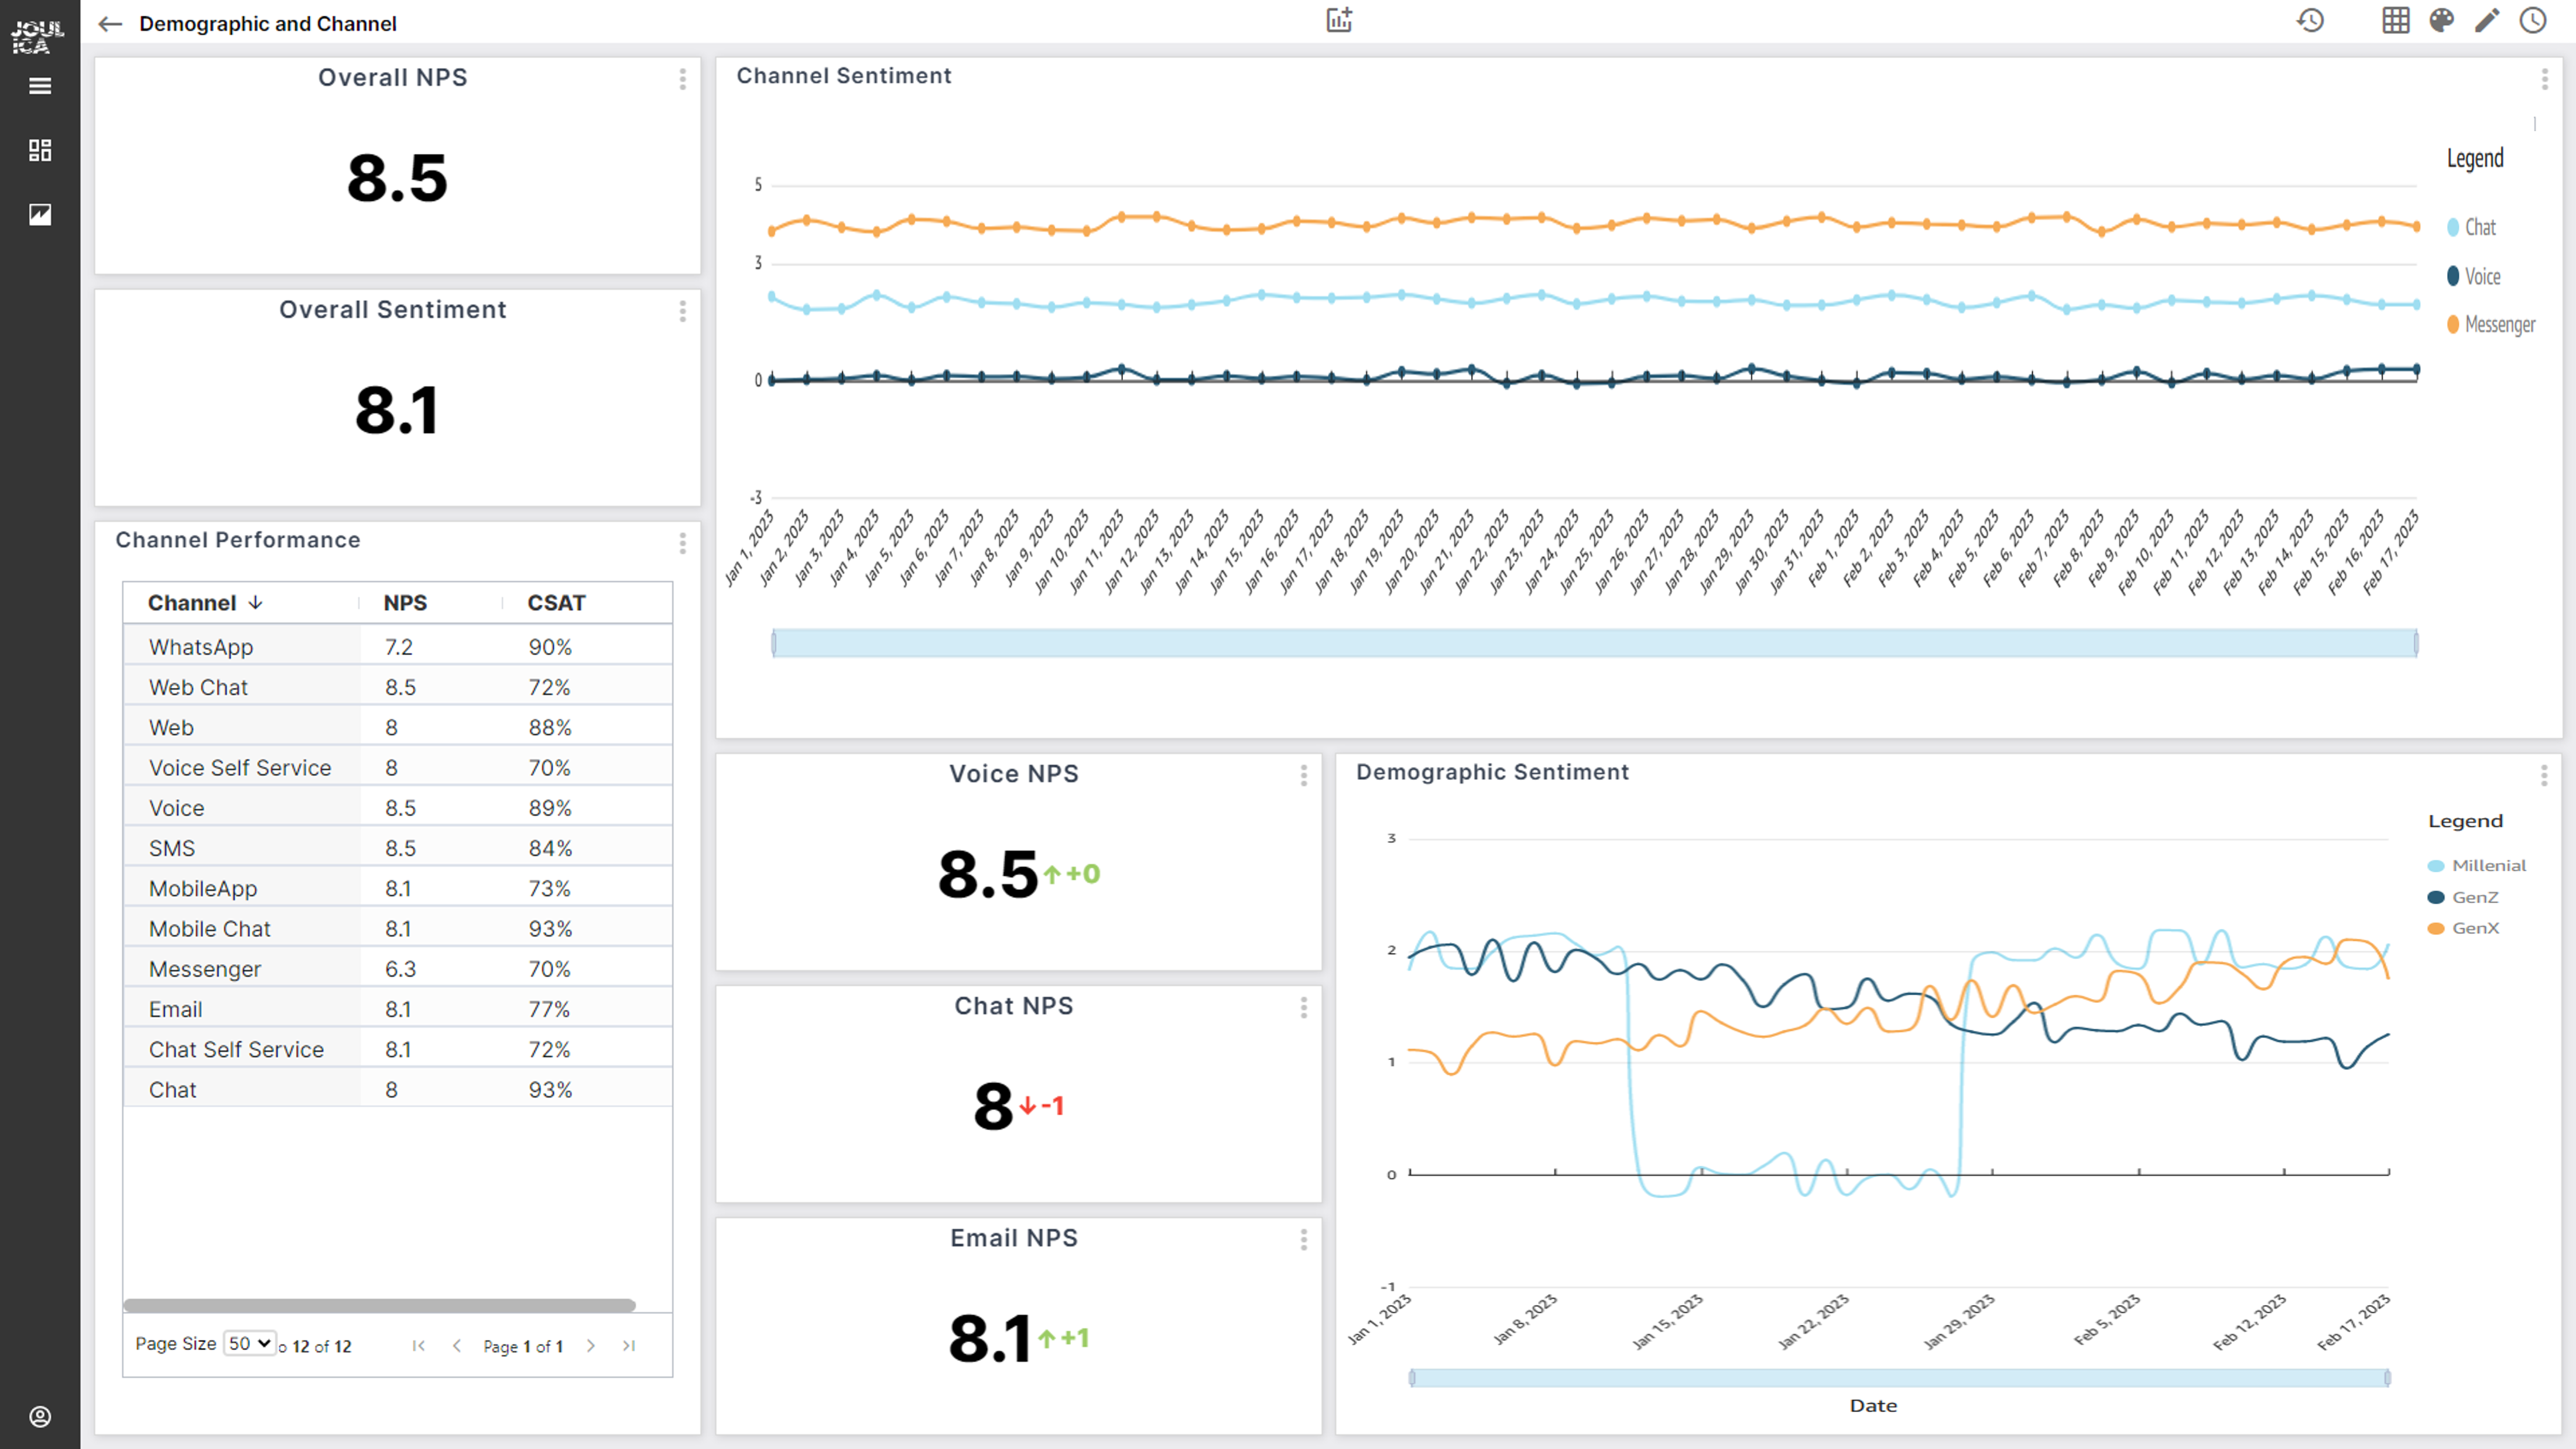
The final analysis shows how additional data, such as customer demographics, can be included in real-time and historical KPIs (here, we receive the demographic data in a contact attribute). So, in addition to analysing sentiment across customer channels (WhatsApp, Messenger, Voice etc), we can break this data down by demographic and other dimensions allowing users to analyse trends over time.
Summary
This post showed a variety of ways that customer sentiment, CSAT, NPS and other customer survey data can be analysed by the Joulica platform, to provide customer experience analytics for Amazon Connect. This data is available for both real time and historically oriented use cases. We also showed several ways that this data can be broken down – e.g., by Channel, Team, Product and Region. In addition to providing real time analytics, we used the Visual Embedding feature from Amazon Quicksight to unify real-time and historical analytics.