Amazon Connect Analytics
 Salesforce Service Cloud Analytics
 Customer Journey Analytics
 Back
Back
At AWS Contact Center Days 2022 this month, Amazon announced the general availability of Amazon Connect Cases. This new capability allows agents to track and manage customer issues that require multiple interactions, with integration between Tasks and Cases allowing Amazon Connect to manage the flow of cases through the system. Whilst this latest innovation was in preview, we used the time to develop a set of out of the box real time and historical analytics that customers can use to gain insights on the customer issues being managed with the Cases feature. This article provides details on these capabilities, with the information provided on both real-time dashboards and Quicksight historical reports.
As detailed in our previous post on Amazon Connect Cases Analytics we use the Cases Event Streams as the primary integration point. The AWS team published a really good article here, on how this event stream can be used to build historical reports for some metrics and is worth reviewing.
Case Metrics
The initial set of metrics is detailed in the following table. A lot of the measures distinguish between Work Items and Contacts. Work Items include Customer voice and chat interactions and Tasks. Contacts are specific to Customer voice and chat interactions.
|
Metric Name |
Description |
|
Active Duration |
Total amount of Active time for Cases that were closed in the relevant time interval |
|
Closed |
Total number of Cases closed in the relevant time interval |
|
Closed Case Customer Contacts |
Total number of Contacts associated with Cases that were closed in the relevant time interval |
|
Closed Case Work Items |
Total number of Work Items associated with Cases that were closed in the relevant time interval |
|
Closure Customer Contacts |
Number of Contacts associated with Cases that were closed in the relevant time interval. This will include all Contacts for Cases that were closed for the first time, but only Contacts since re-open for re-opened Cases. |
|
Closure Work Items |
Number of Work items associated with Cases that were closed in the relevant time interval. This will include all Work Items for Cases that were closed for the first time, but only Work Items since re-open for re-opened Cases |
|
Contacts Associated |
Total number of Contacts associated with Cases in the relevant time interval |
|
Created |
Total number of Cases that were created in the relevant time interval |
|
Duration |
Total amount of time that between Case creation and closure for Cases that were closed in the relevant time interval |
|
False First Contact Resolution |
Total number of Cases closed in the relevant time interval that were closed previously and also previously identified as a first contact resolution Case |
|
First Contact Resolution |
Total number of Cases closed in the relevant time interval that qualify as first contact resolution Cases |
|
First Closed |
Total number of Cases closed in the relevant time interval, for Cases that are being closed for the first time |
|
First Closed Contacts |
Total number of contacts associated with Cases in the relevant time interval, for Cases that are being closed for the first time |
|
First Reopened |
Total number of Cases in the relevant time interval that have been reopened for the first time |
|
Reopened |
Total number of Cases in the relevant time interval that have been reopened |
|
Status Transitions |
Total number of Case status transitions during the relevant time interval |
|
Total |
Continuous count of the number of Cases in each status |
|
Total Contacts Associated |
Continuous count of the number of contacts associated with Cases |
|
Total Created |
Continuous count of the number of Cases created |
|
Total First Contact Resolution |
Continuous count of the number of Cases which qualify as first contact resolution cases. A Case that qualified as First contact resolution but later qualifies as a False First Contact Resolution is decremented from the metric |
|
Total First Closed |
Continuous count of the number of Cases that have been closed for the first time |
|
Total Non Closed |
Continuous count of the number of Cases that are not in the closed status |
|
Total Work Items Associated |
Continuous count of the number of Work Items associated with Cases |
|
Work Items Associated |
Total number of Work Items associated with Cases in the relevant time interval |
|
Average Active Duration |
Average active duration for Cases that were closed in the relevant time interval |
|
Average Duration |
Average duration for Cases that were closed in the relevant time interval |
|
Average Contacts Per Case |
Average number of customer contacts that have been associated with a Case |
|
Average Contacts Per Closed Case |
Average number of customer contacts associated with Cases for Cases closed in the relevant time interval |
|
Average Contacts Per Closure |
Average Number of Contacts associated with Cases that were closed in the relevant time interval. This will include all contacts for Cases that were closed for the first time, but only work items since re-open for re-opened Cases |
|
Average Work Items Per Case |
Average number of Work Items that have been associated with a Case |
|
Average Work Items Per Closed Case |
Average Number of Work Items associated with Cases that were closed in the relevant time interval |
|
Average Work Items Per Closure |
Average Number of Work Items associated with Cases that were closed in the relevant time interval. This will include all work items for Cases that were closed for the first time, but only work items since re-open for re-opened Cases |
|
First Contact Resolution Rate |
Percentage of Cases closed in the relevant time period that qualified as First Contact Resolution |
|
Total First Contact Resolution Rate |
Percentage of Cases closed that qualified as First Contact Resolution |
To get users started, Joulica creates dashboards and reports, which our users can modify as needed. Users can also create their own real-time dashboards and historical reports in a matter of minutes.
Realtime Cases Dashboards
To begin with, the following example dashboard shows real-time metrics for created and completed cases, with a breakdown by priority.
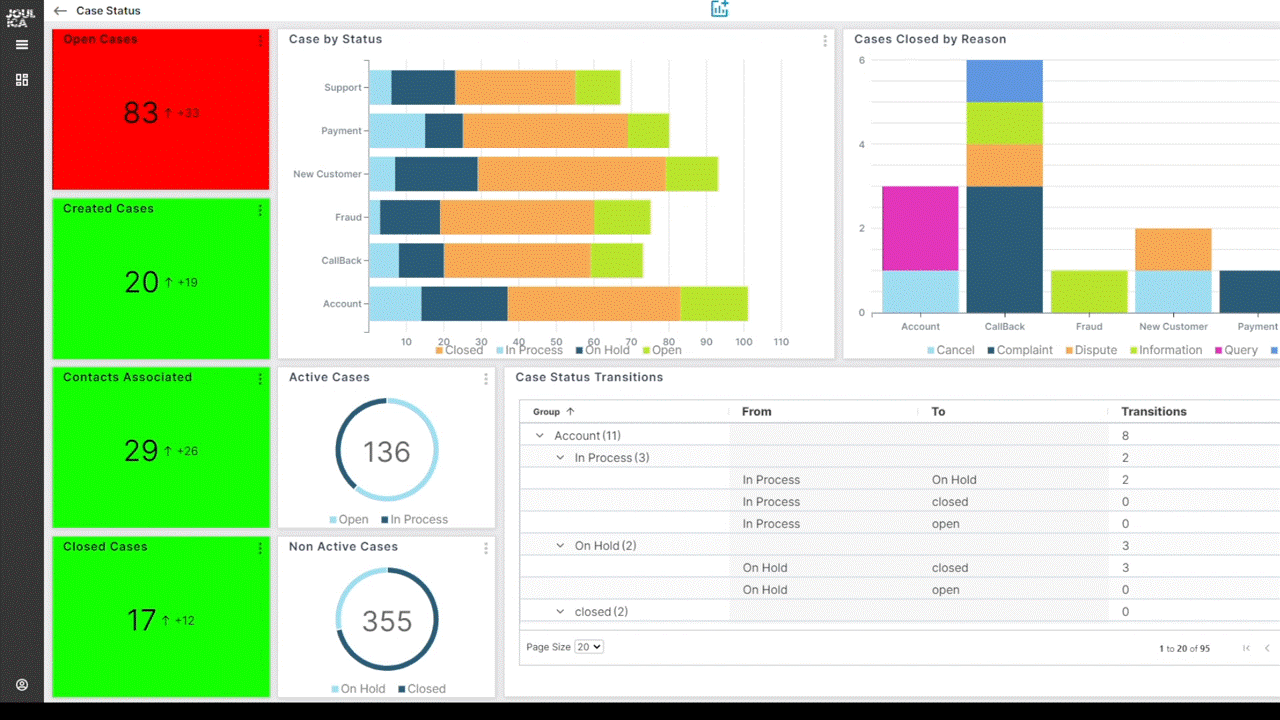
Firstly, this shows the current number of open Cases across all Case Templates, as well as the number of Cases in several key states for each Case Template. As can be seen, the analytics update in real-time as Cases activity progresses during the day (user defined thresholds can be set on all metrics). Also shown is a breakdown of metrics by Case reason, along with Case status changes (highlighting the most dominant transitions for each type of Case). Naturally, Joulica users are free to choose which metrics are included and how these analytics are visualised.
The second example below shows some more advanced metrics, which are equally important when it comes to optimising case management workflows. Firstly, it shows reopen activity (i.e., situations where a Case is closed and then re-opened) and First Contact Resolution (i.e., Cases where closure only required one interaction with the customer) for each Case template.
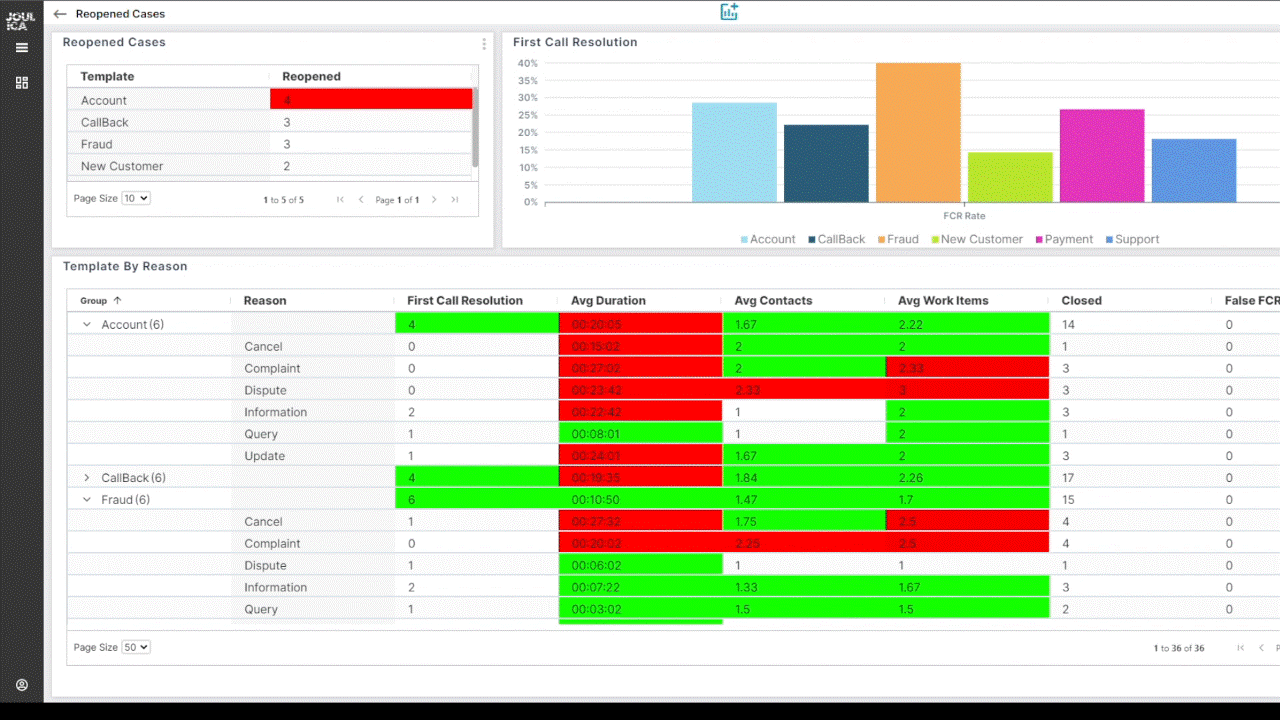
At the bottom of this example, a detailed breakdown of Case analytics is shown for each Template, with a further breakdown by Case reason – including FCR, Average Case Duration, and the Average number of Customer contacts before Case closure. As with the first example, the user is alerted immediately to KPIs which need attention.
On a side note, we found a lot of these metrics were straightforward to produce given the customer journey capabilities of the Joulica platform. This allowed us to track Case activity in a similar fashion to how we track customer journeys, allowing analytics such as the number of contacts before Case closure, Re-opens, and First Contact resolution to be created easily.
Historical Reporting with Quicksight
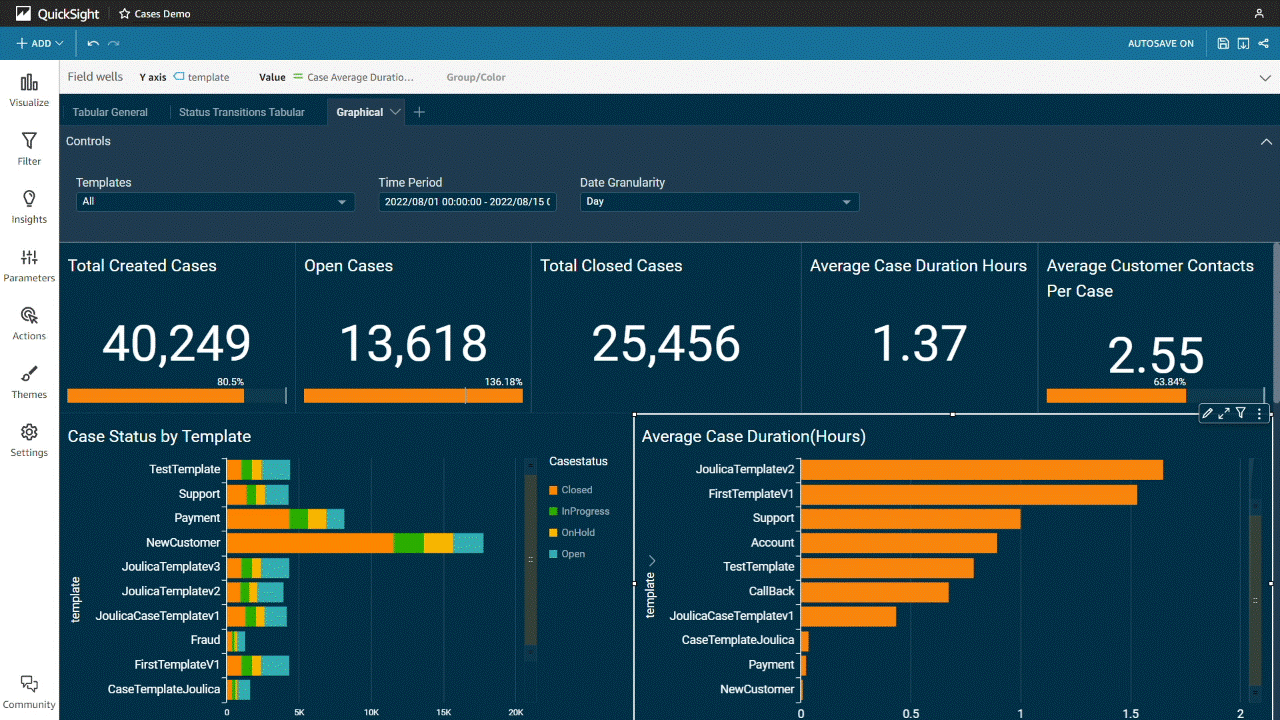
The Joulica platform automatically persists all Case metrics to Amazon RDS, allowing Quicksight reports to be created in a few minutes. Joulica provides a set of standard reports to get users started – some of which are detailed here.
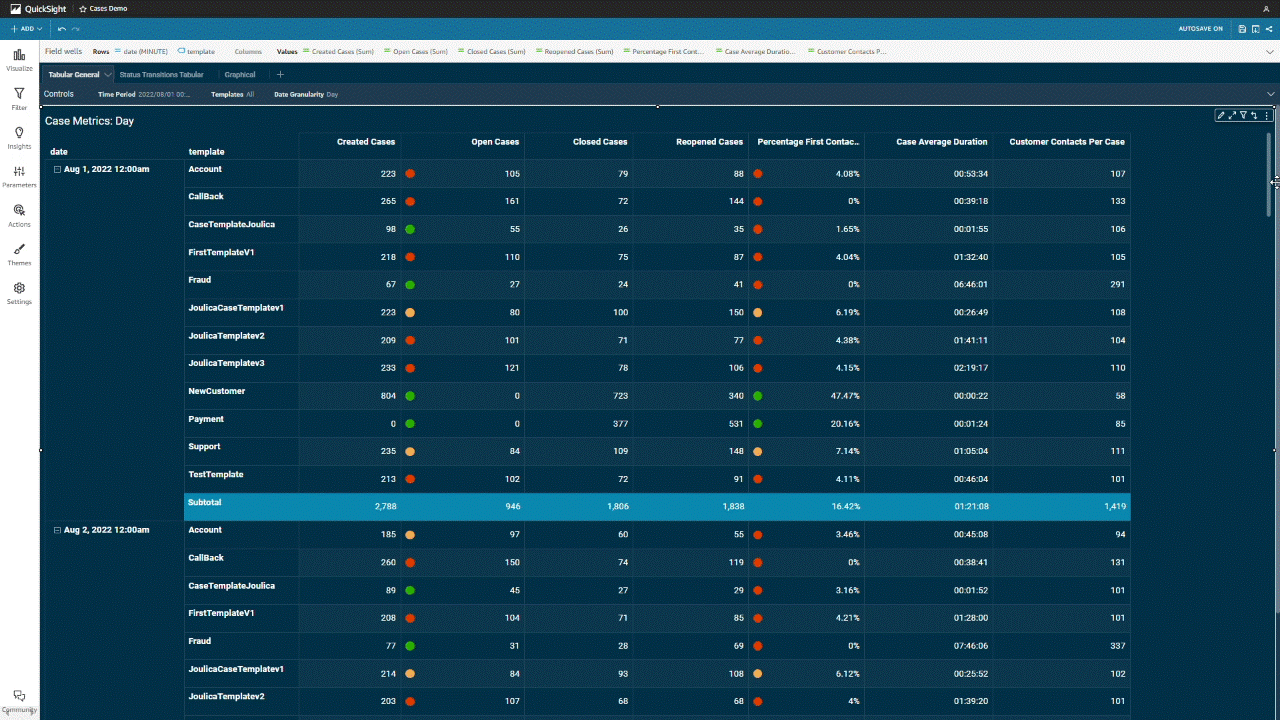
The first Quicksight report includes some of the key Case analytics, along with selectors for Case Templates and Report time periods. KPIs which are critical for process efficiency and customer experiences, such as First Contact Resolution, Re-opens and the Average number of Customer contacts per case is included, with various metrics broken down by Template.
The following report provides a tabular layout, for users who prefer this style of reporting.
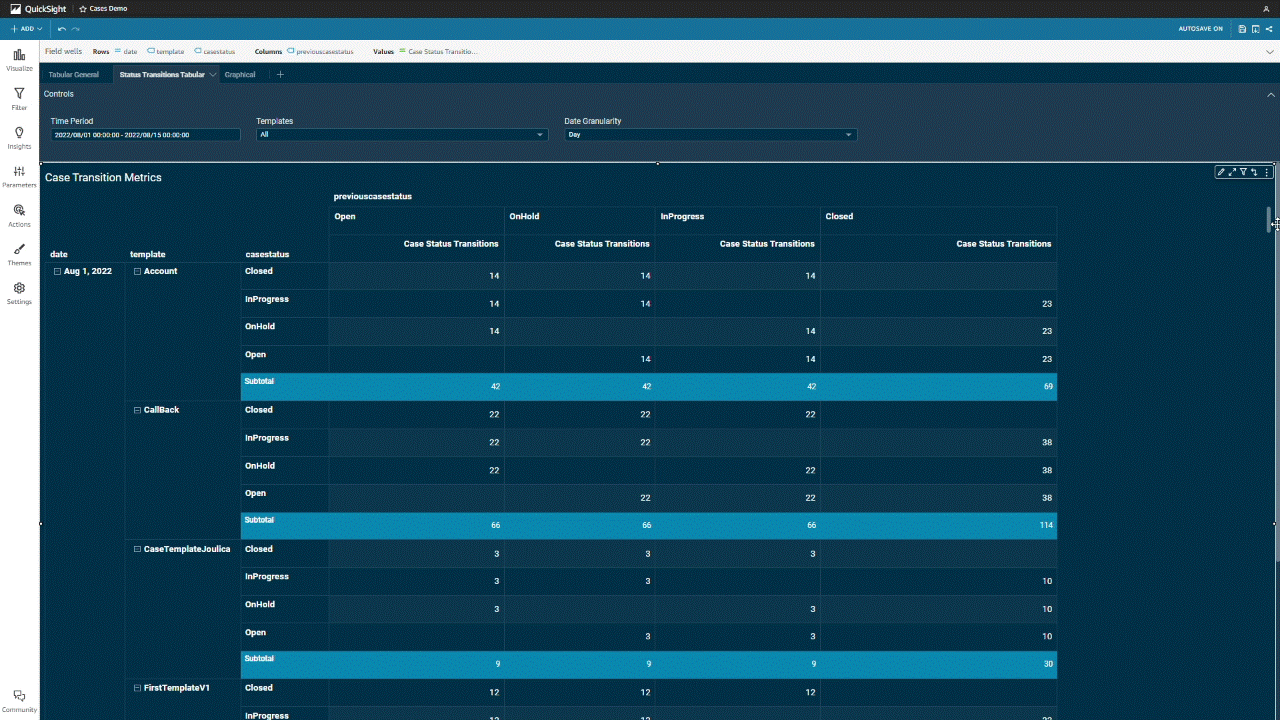
And finally, to allow tracking of critical state transitions, the following report provides a breakdown for each time interval and case template.
Summary
We have detailed the rich out-of-the-box analytics that Joulica provides for Amazon Connect Cases, with this suite of real-time and historical analytics to be expanded upon as we continue to iterate our platform. Whilst we have focussed on Case management related metrics here, all the above capabilities can be unified with other critical Amazon Connect KPIs – with users free to create their own visualisations that combine data from across the Amazon Connect solution into a single pane of glass.
To find out more, get in touch by email at info@joulica.io or contact us to arrange a demo and free trial.